
RESEARCH ARTICLE
Quality Control of Display Devices for Medical Radiodiagnosis Employing the Standard TG18, GSDF and JND
Bruno Ribeiro de Mesquita1, *, C. Ferreira2, Divanizia do Nascimento Souza1
Article Information

Identifiers and Pagination:
Year: 2018Volume: 6
First Page: 21
Last Page: 32
Publisher Id: TOMDJ-6-21
DOI: 10.2174/1875181401806010021
Article History:
Received Date: 19/9/2018Revision Received Date: 6/12/2018
Acceptance Date: 10/12/2018
Electronic publication date: 31/12/2018
Collection year: 2018
open-access license: This is an open access article distributed under the terms of the Creative Commons Attribution 4.0 International Public License (CC-BY 4.0), a copy of which is available at: (https://creativecommons.org/licenses/by/4.0/legalcode). This license permits unrestricted use, distribution, and reproduction in any medium, provided the original author and source are credited.
Abstract
Introduction:
This work presents a study on the procedures for evaluating the quality of imaging display devices in radiology, considering the characteristic luminance curve obtained experimentally versus the Just Noticeable Difference (JND) and the lifetime of digital display devices.
Materials & Methods:
The evaluations were done using image patterns published by the American Association of Physicists in Medicine on Digital Imaging and Communication in Medicine (DICOM) and the Grayscale Standard Display Function (GSDF), viewed in DICOM software, with various shades of gray. A digital luximeter was used as the luminance meter. A correlation with the time of use of the devices was performed to classify the digital devices as primary (suitable for medical diagnosis) or secondary (suitable only for visualization of medical images).
Results & Discussion:
Among the monitors evaluated, those with a resolution between 2 and 5 megapixels were classified as primary for up to 50, 000 hours of use, and some above that time limit present behavior equivalent to secondary monitors. Monitoring the temporal evolution of the use of devices is important to avoid errors in medical diagnosis.
Conclusion:
The use of a calibrated digital luximeter with an illuminance unit conversion factor in luminance defined by this equipment was shown to be an alternative to replace a photometer when this latter is not available.
1. INTRODUCTION
The emergence of digital radiology due to technological evolution has facilitated significant improvements to radiological diagnosis, enabling a greater quality of acquisition, processing and visualization of the images [1, 2]. The tests proposed by the quality control protocols are important to classify image-display devices as primary and secondary devices. Primary devices are employed by the radiologist for diagnostic evaluation and secondary ones are used by other clinicians to visualize the images [1, 2].
Diagnostic quality control is a fundamental study object in medical physics, primarily concerning the evaluation of the quality of display devices that are used in displaying digital images for the definition of a quality medical report [3]. To enable adequate quality control for the display devices, the regulatory agencies, such as American Association of Physicists in Medicine (AAPM), Spanish Nuclear Safety Council and others, determine what tests are conducted to analyze the conformity of these devices to the established compliance limits for primary and secondary monitors, considering the spatial resolution of each one.
The advances in studies on quality control in radiodiagnosis have aroused interest in the development of planned actions, promoting the reliability of current legislation or protocols-based evaluations, such as the protocols published by the American Association of Physicists in Medicine and other institutions with similar interests [4-7].
An important step in this improvement of medical imaging processes took place in the 1970s, when the first digital monitors emerged, associated with computed tomography imaging, and then with ultrasound, digital radiology and magnetic resonance imaging [3]. With the emergence of the Picture Archiving and Communication System (PACS), images have been stored digitally and viewed quickly [1].
Image monitors, representing the main means of communication between a diagnostic equipment and clinical practitioners, are differentiated by their sizes, brands, serial numbers, resolutions, sizes of the pixels that comprise the respective screens and by their image refresh rates. The refresh rate depends on the resolution of the image; line by line and from top to bottom, the image is updated. The number of rows a monitor sweeps per second is called the horizontal frequency. Initially, the monitors were Cathode Ray Tubes (CRT), which were gradually replaced by Liquid Crystal Displays (LCD) and plasma screens [8, 9] In typical radiology workstations, slight differences in appearance as a result of not meeting the minimum standards could result in images looking very different, potentially leading to interpretation errors [10].
This study aimed to investigate the relationship between the quality of the image displayed by digital display devices used in medical diagnosis and their time of use. A probable correlation between the resolution of a display and its lifetime was studied. For this, a methodology was used that replaces the photometer, which is the ideal luminance meter, by a luximeter with its due conversion factor of lux units in cd/m2. From the obtained results the image-display devices are classified as primary or secondary devices.
2. EVALUATION OF MEDICAL DISPLAY DEVICES
Some basic concepts that we consider relevant of the broad understanding of the discussions presented here will be summarized below.
A radiological medical display device is a digital monitor, with adequate visual quality, that presents a certain shade of gray perceptible to the human eye, if such device has no color display. To ensure the quality and reliability of the radiologically presented image, on each display device the image must be calibrated in the standard Digital Imaging and Communication in Medicine (DICOM) Grayscale Standard Display Function (GSDF), presenting minimum photometric requirements, according to the recommendations of the quality control protocols.
Digital radiological images present several tonal gradations, usually on grayscale levels. For very similar tones, perception by the human eye is difficult. Concern with this perception led to the development of a model that defined a perceptible limit between an image with a certain level of gray in relation to another. This model considers the sensitivity of the human visual system (HVS) in low contrast, with the uniform sine luminance signal in all shades of gray, requiring a change of luminance to enable the perception of visual aspects determined with the HVS [11].
Based on the model and perception of contrasting structures in a digital image, the DICOM GSDF standard emerged, which lays down the amount of grayscale levels that an image should present, related to the number of bits of the image, so that an image can be transferred from one system to another without the pixel specification of that image. The GSDF is a mathematical mapping of an entry index of the Just Noticeable Difference (JND) for luminance values that make it possible to distinguish between shades of gray. With quality control tests we can graphically analyze this pattern and define the difference between digital images by means of graphical analysis of a characteristic curve [12, 13], The efficiency of evaluating the quality of the display of radiological images on a device, together with the DICOM standard GSDF, ensures that professional radiology can differentiate the pixel quantities into a digital radiological image. On the other hand, the Look-Up Table (LUT) presents the luminance intensities on several grayscales, these being an intrinsic property of each radiological monitor [1, 14].
Photometry is the branch of optics related to the measurement of luminous flux and the intensity of the visible electromagnetic radiation, according to the sensitivity of the human eye [4]. In photometry, the following magnitudes are defined: luminance and illuminance.
The quality classification of monitors in medical diagnosis is based on values obtained for luminance, ambient illuminance and luminance ratio parameters.
Luminance is the photometric term used to describe the rate at which visible light is emitted from a surface [4]. The luminous intensity per unit of area of a surface in some direction is defined by cd/m2.
Illuminance is the ratio between the luminous flux (Φ) that focuses perpendicularly on an area (a), and the unit of measurement in Lumen per square meter (lm/m2), which is called the Lux (LX). In illuminance quantity, the cosine law is considered for treating the propagation of light, and the law of additivity defines that the total lighting produced by various sources of light is given by the superposition of the energies of each source.
Task Group 18 (TG18) of the American Association of Physicists in Medicine [4], along with the Royal College of Radiologists (RCR), has established rules for physical and anatomical tests applicable in evaluating digital radiological imaging display devices. To conform to the protocols, such monitors must provide a quality image with spatial detail at a normal viewing distance between 30 and 60 cm.
For evaluation of the monitors, a protocol should be followed, such as those published by as AAPM [4], and those published by European associations [5, 6] which present quality control procedures for monitors and establish the parameters that classify the imaging devices as either primary or secondary, defining also the type of use made of them. In this work the protocol followed was published by AAPM in 2005 [4]. The tests conducted were those of diffuse reflection, specular reflection, internal reflection or candle, resolution, noise, luminance and contrast response and luminance uniformity.
The diffuse reflection test evaluates the possible perception of a decrease in contrast on the monitor screen with the device switched off or in energy-saving mode. For this, the diffuse reflection coefficient is calculated from the ratio between the luminance (obtained with a photometer on the monitor screen) and illuminance environment (obtained with a luximeter near the evaluated device).
Specular reflection is the mirrored reflection of a light source external to the device. This reflection can be quantified with a coefficient relating the apparent luminance of a source of reflected light and the actual luminance source, according to the following equation (1):
 |
(1) |
where L is the minimum luminance, Ia is the environmental illuminance, and Ct is the contrast threshold, which depends on the values of maximum and minimum luminance, ranging from 0.032 to 0.021.
Two TG18-GV test patterns are used for the test of internal reflection. One consists of a white circle, which, when replaced by another with a black circle, creates a pattern that is totally black, except for the presence of low contrast targets [4]. The test checks how many structures are visible in each pattern. For classifying the devices as primary or secondary, initially, it checks if the structures are visible in the standard TG18-GV and, then, how many of these are visible in the standard test image TG18-GVN.
The display resolution of a monitor can be assessed visually by analyzing the appearance of TG18-CX test patterns [4], which feature elements of the pixel size of the display. For this, the capacity of the monitor to present the smallest possible structure of an image is verified. For the result not to be limited by the Modulation Transfer (MTF) of the human eye, it is recommended to use a magnifying glass in the evaluation; the TG18-CX standards must be between 0 and 4 for the monitors to be classified as primary and 0 to 6 for secondary monitors.
Noise is an indicator of the luminance behavior of a display monitor. If the noise test identifies some behavioral failure, the luminance and contrast response should be verified [4]. The test consists of observing a series of small frames containing small low-contrast structures in each quadrant of the image display device [7]. Thus, the existence of artifacts or defective pixels that could compromise the visualization of small structures with a low-level contrast [15, 16] is verified. The standard test image used is TG18-AFC, divided into four quadrants, containing several areas. To classify the digital monitors, it is necessary to visualize at least three of the four quadrants at all visible points. For medical imaging displays, at least two of the four quadrants should be displayed [4, 5, 14].
The luminance and contrast response of a display is the ratio of measured luminance, luminance ratio and contrast ratio defined for a standard system, consisting of light produced by a display device in the maximum luminance range (Lmax) and minimum luminance (Lmin), together with the diffusely reflected fixed contribution of the ambient light (Lamb) [4]. The characteristic luminance curve of a given monitor should be in accordance with the DICOM GSDF curve, presenting the luminance values in various shades of gray, or color, depending on the ambient illumination [16]. The luminance response is evaluated as shown in Fig. (1). The Lmax value should be greater than 170 cd/m2 for primary monitors and greater than 100 cd/m2 for medical imaging displays. The ratio between maximum and minimum luminance is called the Contrast Response parameter (CR). This parameter must be greater than 250 cd/m2 on the primary monitors and 100 cd/m2 on the secondary [4, 15]. Luminance analyses in different TG18-LN standards should result in different magnitudes due to the influence of the brightness of the display device.
 |
Fig. (1). Schematic representation of the luminance measure in TG18-LN, adapted from [1]. |
The evaluation of luminance uniformity is done with standard test images with 10% and 80% of maximum luminance. With these images, it is verified if there is any variation of the luminous intensity in regions of the screen with the same shade of gray. One should evaluate the GSDF in various regions of the monitor screen to observe the luminance uniformity [6, 7]. The images for this test are TG18-UNL80 and TG18-UNL10 [4]. The luminance values of the four edges and center of the test image cannot vary by more than 15% in LCD monitors [15,17, 18].
The interest in this type of study should continue to grow, in view that currently radiographic records are evaluated almost exclusively on digital monitors. An example is a work recently published by Ekpo and McEntee [19] on the physical and psychophysical evaluation of new primary medical-grade color displays.
3. MATERIALS AND METHODS
In this study, 38 monitors were evaluated (Table 1); thirty-two of the BARCO brand and six of the EIZO, with different models, serial numbers, lifetime and spatial resolution characteristics. The BARCO and EIZO brands were the only ones we had access to. Their usage time was based on the data obtained in the configuration system of each device. The serial numbers of the monitors are purposely incomplete to avoid identifying the institutions that own the devices; such identification would not be relevant to the analysis in question.
| Monitor | Brand/Model | Serial Number | Maximum Resolution | Lifetime (hours) |
|---|---|---|---|---|
| 1 | Barco-MDRC 2124 | 9xxx4 | 1920 x 1200 | 299 |
| 2 | Barco-MDRC 2124 | 9xxx4 | 1920 x 1200 | 184 |
| 3 | Barco-MDNC 4130 | 1xxx5 | 1980 x 1200 | 66,887 |
| 4 | Barco-MDRC 2224 | 9xxx0 | 1920 x 1200 | 7,004 |
| 5 | Barco-MDRC 2224 | 9xxx6 | 1920 x 1200 | 12,048 |
| 6 | Barco E-3620-MA | 1xxx5 | 1920 x 1200 | 1,756 |
| 7 | Barco-E-3620-MA | 1xxx6 | 1920 x 1200 | 10,354 |
| 8 | Barco-MDRC 2124 | 9xxx0 | 1920 x 1200 | 287 |
| 9 | Barco-MDRC 2124 | 9xxx2 | 1920 x 1200 | 710 |
| 10 | Barco-MDRC 2124 | 9xxx9 | 1920 x 1200 | 8,124 |
| 11 | Barco-MDRC 2124 | 9xxx2 | 1920 x 1200 | 468 |
| 12 | Eizo-RadioForce MX300W | 2xxx9 | 1280 x 1600 | 1,349 |
| 13 | Eizo-RadioForce MX300W | 2xxx9 | 1200 x 1600 | 4,522 |
| 14 | Eizo-RadioForce GS320 | 2xxx9 | 1536 x 2048 | 1,3147 |
| 15 | Eizo-RadioForce GS320 | 2xxx9 | 1536 x 2048 | 1,2580 |
| 16 | Eizo-RadioForce MX300W | 2xxx0 | 1200 x 1600 | 1,2603 |
| 17 | Barco - MDCC 4130 | 2xxx2 | 1280 x 1600 | 292 |
| 18 | Barco - MDCC 6230 | 1xxx0 | 3028 x 2048 | 11,957 |
| 19 | Barco - MDCC 4130 | 1xxx8 | 1280 x 1600 | 13,133 |
| 20 | Barco - MDCC 4130 | 1xxx3 | 1280 x 1600 | 13,166 |
| 21 | Barco-MDCC 4130 | 1xxx9 | 1280 x 1600 | 13,130 |
| 22 | Eizo-RadioForce MX300W | 2xxx9 | 1200 x 1600 | 18,922 |
| 23 | Barco-MDCC 4130 | 1xxx1 | 1280 x 1600 | 13,141 |
| 24 | Barco-MDRC 2224 | 9xxx0 | 1920 x 1200 | 2,162 |
| 25 | Barco-MDRC 2124 | 9xxx3 | 1920 x 1200 | 878 |
| 26 | Barco-MDRC 4130 | 9xxx9 | 1920 x 1200 | 23,755 |
| 27 | Barco-MDNC 4130 | 1xxx0 | 1280 x 1600 | 66,084 |
| 28 | Barco-MDRC 2124 | 9xxx9 | 1920 x 1200 | 5,673 |
| 29 | Barco-MDRC 2224 | 9xxx4 | 1920 x 1200 | 117 |
| 30 | Barco-MDRC 2124 | 9xxx2 | 1920 x 1200 | 222 |
| 31 | Barco-MDRC 2124 | 9xxxx5 | 1920 x 1200 | 120 |
| 32 | Barco-MDNC 4130 | 1xxxx9 | 1980 x 1600 | 65,227 |
| 33 | Barco-MDNC 2124 | 1xxx4 | 1200 x 1600 | 57220 |
| 34 | Barco-MDRC 2124 | 9xxx6 | 1920 x 1200 | 430 |
| 35 | Barco-MDRC 2124 | 9xxx7 | 1920 x 1200 | 680 |
| 36 | Barco-MDRC 2124 | 9xxx6 | 1920 x 1200 | 331 |
| 37 | Barco-MDRC 2124 | 9xxx6 | 1920 x 1200 | 534 |
| 38 | Barco-MDRC 2124 | 9xxx7 | 1920 x 1200 | 553 |
The software used to view and analyze standard TG18 test images was initially installed on monitors where these standards were not available. For the tests, the rooms where the devices were installed were left without ambient light or with adequate minimum illumination to avoid interference from external light sources on the measurements.
The monitors were installed in four rooms, each measuring 8 x 8 m2. Ten monitors were installed in three of the rooms and eight in the other room. The minimum distance between two monitors was 1.5 m.
Isite Radiology of Philips, Radiant Dicom and Micro Dicom were used as the medical image processing and display software in DICOM format. Such software has several tools that allow the manipulation and measurement of the parameters of the images, such as brightness, zoom, rotation and reversal of images, marker pen and angular value. The standard TG18 test images used corresponded to 8-bit (256 grayscale, 1000 pixel - 1K format) and 12-bit (4096 grayscale, 2000 pixel - 2K format) formats.
In the first stage of the quality evaluation, the lack of luminosity was confirmed. The evaluations were carried out with a PTW CD Lux Meter S/I, with uncertainty of 2%, calibrated in September 2017, and a Minipa Digital Luximeter (MLM1020). The experimental uncertainty based on instrumental uncertainty was 5%.
A conversion factor of 18.51 was used to convert lux into cd/m2 in the evaluations of photometric magnitudes with a luximeter serving as the photometer. This factor was previously defined by the equipment manufacturer. For all the evaluated monitors, a single brightness pattern of 80% was established. The results regarding the luminance and contrast response test were inserted into a worksheet for comparison with the limit of 10% of the JND and for determining the display luminance ratio, through Equation 2:
 |
(2) |
The quantitative evaluation in the diffuse reflection test was performed by measuring the luminance (ambient light) with the luximeter on the display device, while it operated in energy-saving mode or switched off. Then the value of the illuminance environment was obtained with the luximeter at 30 cm from the monitor. The luminance environment did not exceed 2/3 of the minimal luminance of the monitor. The data obtained was replaced in the equation 1 to define the diffuse Reflection coefficient (Rd) for all devices.
The measurement of the coherence of a diagnostic imaging device, in terms of qualitative aspects of specular reflection, certifies whether there is any formation of mirror images resulting from reflections of external light sources and whether these reflections influence the TG18-AD test patterns [4] displayed in the image monitor at the time of evaluation.
In the internal reflection test with the TG18-GV test patterns, the images were observed to determine if all structures were visible and if the number of visible structures was defined with the TG18-GVN image. For monitors to be classified as primary, it is necessary to visualize a minimum of three structures. The quality of the display devices in the diagnosis (display resolution), based on the resolution test, was evaluated quantitatively with the standard image test TG18-CX, in a zoom of 100%, using a magnifying glass of 90 mm with 2x increase.
The quantitative analysis of the noise test was performed with the image TG18-AFC [5] divided into four quadrants, each being classified respectively as 20-2, 30-3, 40-4 and 60-6. For display devices to be classified as primary, three of the four quadrants should be viewed with all visible points. This test does not require instruments, only HVS. The measurements carried out occurred in the diagnostic reading stations with the illuminance environment in low quantity.
The luminance and contrast response tests aim to gauge the monitor's luminance values in the 18 different levels of gray in the standard TG18-LN12 test image. The measurements were made with the software Isite Radiology of Philips, in the format 1 K, employing a meter, luximeter and considering devices of various resolutions, brands and lifetimes. The measurements were carried out with the luminance meter at the center of each image test at the end of the working day or at intervals during the expedient, in order not to hinder the progress of the work of the institution. In the analysis of minimum luminance values, with the image test TG18-LN12-01, the monitor had a standard brightness of 80%. The maximum luminance was defined with the TG18-LN12-18 image displayed on the monitors with maximum brightness.
To confirm that a monitor is suitable for medical diagnosis, experimental results are inserted into a database and compared with an acceptable GSDF and within 10% of JND.
In the luminance uniformity test, it is verified that in the monitor screen there are regions with a certain variation for the same gray tone. The ratio between the luminance at each edge and the center of the monitor image should not exceed 30% for primary monitors and 15% for secondary monitors. The luminance uniformity measurements were carried out with a luximeter positioned on the four edges and in the center of the standard test images TG18-UNL10 and TG18-UNL80, as established by the quality control protocols.
The minimum resolution for viewing radiographic images in mammography exams is 3 megapixels [4]. AAPM provides TG18 test patterns in 8- and 12-bit formats for monitor evaluation.
4. RESULTS AND DISCUSSION
The diffuse reflection coefficient (Rd) has a strong correlation with the contrast of the image displayed in terms of the ambient luminance, illuminance and detection of visible structures on the monitor when off or in power-saving mode. In general, the luminance environment presented equal values for all monitors, regardless of the room they were in and the maximum resolution of these devices. With respect to the diffuse reflection coefficient, different values were found for each of the monitors due to the lifetime of each and the variation of the illuminance. Quantitatively, a percentage of 66.6% of the ambient luminance was verified for all monitors with respect to the minimum luminance value of the monitor of approximately 0.19 cd/m2, confirming an equal minimum luminance for all monitors. With this, it can be stated that with the illuminance within the standards established by the quality control recommendations, there was no interference in the contrast or visualization of external structures reflected in these monitors.
The coefficient of diffuse reflection has a direct relationship with the specular reflection, being used in obtaining the speculation coefficient of reflection. For this, consideration is given to the illuminance of the environments and possible mirrored structures on the monitor, resulting from external light sources focusing directly or indirectly on the monitor. The position in which a monitor is in relation to the sources of light can influence the specular reflection coefficient, causing the formation of spurious images that influence the contrast of the devices, in turn causing inadequate illuminance levels. Based on the results of this test, 28 of the evaluated monitors were classified as primary monitors.
The results of the internal reflection or velar test carried out with the TG18-GV image showed that on all the rated display devices it was possible to observe this image with the five completely visible structures, meaning the absence or low level of diffuse and specular reflection. This also indicates that the usage time of the device did not interfere with viewing the images. In relation to the number of structures visible in the TG18-GVN test pattern, it was also possible to observe five structures on all the monitors evaluated. Thus, all could be used for medical diagnosis.
The resolution test quantifies the TG18-CX patterns in a given image displayed on the display devices. If the presence of diffuse reflection and speculation is verified, it is appropriate to observe whether it damages the visualization of the patterns in the image. In general, for all monitors displaying the image TG18-CX = 1, viewed with a zoom of 100%, the same amount of structures is seen in the center, upper right corner, upper left, lower left and bottom right. Qualitatively, the visualization of all structures was enough to classify the monitors as primary.
The luminance response and the contrast parameters are related to the quality of the radiological image pixels. The noise test quantifies the low-contrast structures visible in the standard TG18-AFC test image considering a perfect-fit human visual system. For all the rated monitors no structures were displayed in Quadrant 20-2. In 32 of the monitors 59 structures were observed in the quadrants 40-4 and 60-6 and 58 structures in quadrant 30-3. For this test, apart from the four monitors that showed a lifetime of above 50,000 hours, all could be considered primary. Those that were not classified as primary probably possessed many bad pixels, which is expected for monitors that have been used for a longer time.
Luminance levels in the 18 standard TG18-LN12 test images were evaluated with the luminance and contrast response test, and compared to the GSDF and JND pattern. Table 2 shows the data values obtained for monitor 1 and a luminance graph versus JND with experimental points also obtained for all the rated display devices. This analysis defines the luminance response, the characteristic luminance curve according to the JND, and the illuminance values with its due calibration factors.
| TG18 test pattern | Pixel values | Illuminance (lux) | Luminance (cd/m2) | JND | Contrast threshold |
|---|---|---|---|---|---|
| TG18 -LN12-01 | 0 | 0.03 | 0.37 | 37.72 | - |
| TG18 -LN12-02 | 240 | 0.08 | 1.30 | 82.69 | 1.11 |
| TG18 -LN12-03 | 480 | 0.17 | 2.96 | 126.44 | 0.78 |
| TG18 -LN12-04 | 720 | 0.28 | 5.00 | 161.28 | 0.51 |
| TG18 -LN12-05 | 960 | 0.44 | 7.96 | 197.36 | 0.46 |
| TG18 -LN12-06 | 1200 | 0.66 | 12.03 | 233.57 | 0.41 |
| TG18 -LN12-07 | 1440 | 0.93 | 17.03 | 267.03 | 0.34 |
| TG18 -LN12-08 | 1680 | 1.30 | 23.88 | 302.19 | 0.33 |
| TG18 -LN12-09 | 1920 | 1.75 | 32.21 | 335.37 | 0.30 |
| TG18 -LN12-10 | 2160 | 2.32 | 42.76 | 368.46 | 0.28 |
| TG18 -LN12-11 | 2400 | 3.05 | 56.27 | 402.00 | 0.27 |
| TG18 -LN12-12 | 2640 | 3.93 | 72.56 | 434.23 | 0.25 |
| TG18 -LN12-13 | 2880 | 5.07 | 93.66 | 467.64 | 0.25 |
| TG18 -LN12-14 | 3120 | 6.55 | 121.06 | 502.18 | 0.26 |
| TG18 -LN12-15 | 3360 | 8.23 | 152.16 | 533.68 | 0.23 |
| TG18 -LN12-16 | 3600 | 10.30 | 190.48 | 565.23 | 0.22 |
| TG18 -LN12-17 | 3840 | 13.2 | 244.16 | 600.70 | 0.25 |
| TG18 -LN12-18 | 4080 | 16.50 | 305.24 | 633.08 | 0.22 |
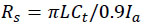
Fig. (2) shows the correlation between the luminance values obtained with the PTW meter and those obtained by converting illuminance with the conversion factor of 18.51, established for the Minolta luximeter. With the division by a factor of 1.9, the luminance results obtained with the luximeter were similar to those defined with the photometer, which is the standard equipment for luminance measurement.
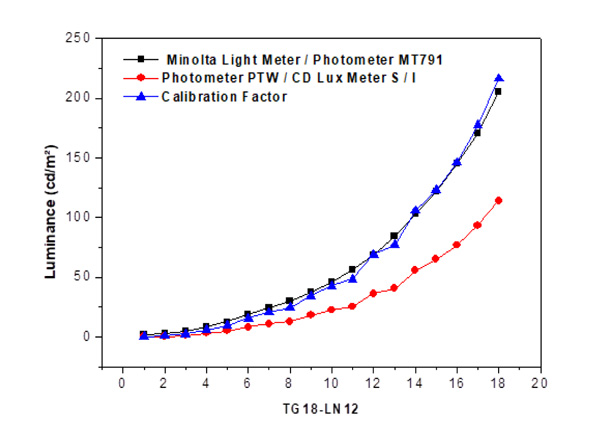 |
Fig. (2). Correlation between the luminance values obtained with the PTW meter and those obtained from the conversion of illuminance with a factor of 18.51, established for the Minolta luximeter versus luminance in TG18-LN01-18. |
The data in Table 2 for monitor 01 showed a luminance ratio of 825, which was obtained with Equation 2. These results are suitable, being greater than 250, as desired for primary monitors, and because they conform to the 10% variation of JND. This device presented 299 hours of use in an ambient luminance equivalent to 0.19 cd/m2, which is suitable to be used in medical diagnosis. The maximum luminance value for monitor 01 was also in agreement with those expected for primary monitors. The characteristic curves of luminance versus JND are in agreement with figure 45 of Report 03 [4].
The luminance versus JND data for eight of the monitors is shown in Fig. (3). All other monitors presented a JND luminance curve similar to those shown in this figure. Considerations on some of the results obtained will be presented below.
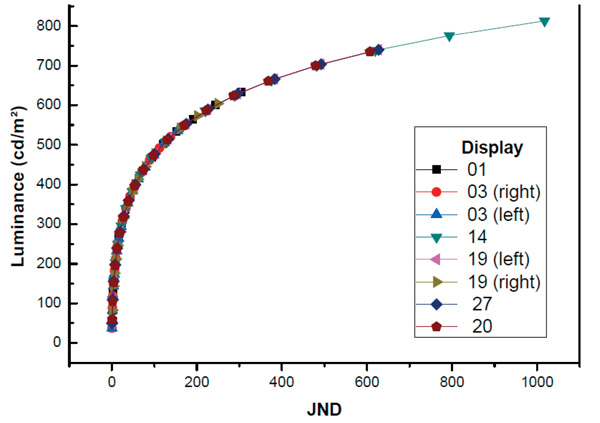 |
Fig. (3). Characteristic luminance curve for JND with brightness of 80% for monitor 01, 03, 14, 19, 20, and 27. |
The screen of monitor 3 was divided into two, allowing the evaluation of a test image on each side (right and left monitor). This device had the longest use, 66,887 hours. As for the luminance values in the center of the standard test image TG18-LN12, a difference was observed of around 40 units with respect to the ratio of luminance and the contrast ratio. However, with the same illuminance environment and minimal luminance, the maximum luminance for the right monitor was 154.74 cd/m2 and for the left was 170.30 cd/m2. This difference is likely to result from the existence of defective pixels on the monitor.
Display 3 has been on 24 hours a day, so nearly 67,000 hours of use implies 7.6 years. The results obtained for this display are at odds with the GSDF and with the limits of 10%, presenting an overlay of the three curves observed in the chart. The display was classified as secondary, in accordance with what was completed through the noise test.
To obtain the characteristic luminance curve of display number 14 used in mammography, the resolution of this device was adequate to carry out a report of this type of examination, i.e. with a minimum resolution of 3 megapixels [18]. The luminance for this device follows the GSDF pattern, in accordance with the percentage limits of JND. Considering the minimum resolution required, this device can be classified as primary.
Fig. (4) shows the data of maximum luminance as a function of time of use for the monitors that presented adequate luminance to be classified as primary monitors. The monitors that were classified as secondary from their luminance present longer lifetimes than monitors classified as primary (Fig. 5). From the comparison of the data shown in both Figs. (4 and 5), it is possible to affirm that the time of use is a relevant factor to define the appropriate radiological utility of this type of device.
The behavior of the luminance graph measured in device 19, also used for mammography, was similar to that of the device used for mammography reporting in terms of the luminance values, albeit with a smaller resolution, presenting a difference in relation to GSDF and JND. This device was within the same conditions as the illuminance environment of the display, although the lifetime was 5% less than the display used for mammography diagnosis, which can explain the luminance values, luminance ratio and the ratio of higher contrast.
Device number 27 showed equivalent characteristics to device number 32, including in relation to the lifetime, with just over 60,000 hours. With respect to the GSDF pattern and the JND, the characteristic curve for this device presented a response within 10% of the JND. By experimentally analyzing the luminance values, it was found that the ratio of luminance and the contrast ratio define it as a secondary display. The noise test also defines it that way. This device probably suffered a loss of pixels over time, considering its prolonged use.
 |
Fig. (4). Maximum luminance as a function of time of use of primary monitors. |
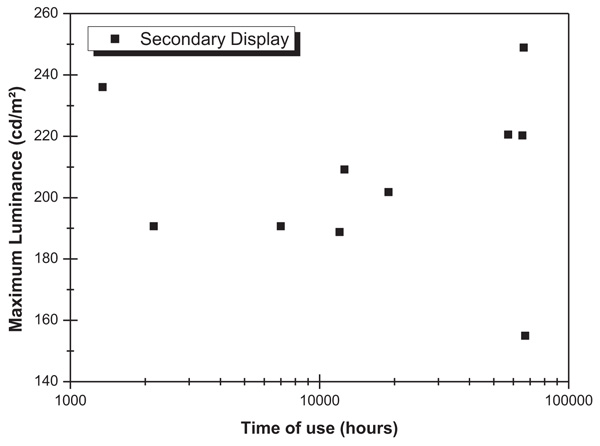 |
Fig. (5). Maximum luminance as a function of time of use of secondary monitors. |
In the evaluation of the display device divided left and right with a lifetime similar to the mammography device, and according to the characteristic curve, a response was obtained according to that expected in terms of the standard GSDF and the limits percentages of JND, due to the curves being adjusted to more or less 10%. This device was being used for a report on computed tomography, general radiology, and hemodynamics. In terms of maximum luminance, it was found that the device complied with the quality control protocols within the established limits. The device, equivalent to mammography use, was divided into right and left monitors to view two images simultaneously. A difference in relation to the maximum luminance values was noticeable. However, this device presented a low specular reflection coefficient, so this variation did not compromise its use for a medical report. In terms of maximum luminance, the values on both sides of the display followed the recommendations required. The luminance ratios of 1140 and 831 for the left and right monitors, respectively, classify the monitor as primary. The contrast ratios with values of 848 and 656 confirm this. Although this device presented a resolution of 2 megapixels, thus less than the mammography display, its characteristic curve is similar to that of the display used for mammography reporting, and this device may be used for this medical purpose.
Quality control of display devices for diagnosis with the temporal analysis required more than one evaluation, which was the luminance uniformity test. In general, for all devices, the luminance values on the four edges and center of the test images presented the percentages predicted for maximum luminance.
As for the luminance values in the regions of the standard image of this test, regardless of the mark, resolution, and lifetime of the imaging devices, the results showed a variation between the center of the image and the edges that did not exceed 30%. This means that displays with a long time of use, as in the case of those with more than 50 000 hours of use, did not disagree with the quality control protocols. Thus, according to this test, all are classified as primary, for presenting luminance values defined by the quality control protocols.
CONCLUSION
Imaging devices used for radiological diagnosis were analyzed qualitatively and quantitatively in terms of photometric magnitudes. The evaluation of these digital displays, based on the quality control protocols, mainly about the AAPM, made it possible to classify the monitors as appropriate for medical diagnosis (primary) or only for the visualization of medical images (secondary). The variability of manufacturing marks, distinct series numbers, maximum resolution and the lifetime of the devices resulted in differences between their image quality parameters, including the lifetime of the display, as verified by the results obtained. The alternative measurements taken with a calibrated digital luximeter with an illuminance unit conversion factor in luminance defined by this equipment mean that it can be used to replace a photometer when the latter is not available. The quantitative calculations of diffuse and specular reflection coefficients helped in the qualitative understanding of how structures formed by external light sources impair the visualization of medical images, compromising the medical diagnosis.
The qualitative results involving the tests of resolution, noise and internal reflection ensure to classify the monitors as primary and suitable for medical diagnosis, except for those with longer use. The levels of illuminance measured in radiology rooms with primary and secondary devices were all in the range or below the maximum levels recommended by quality control protocols, which establishes around 2 to 10 lux. Of the 38 monitors evaluated, 73% revealed an adequate quality control standard for the medical diagnosis.
The GSDF characteristic curves of each device, considering the lifetime, made it possible to verify that the displays were in accordance with the JND. Thus, devices with resolutions between 2 and 5 megapixels can be classified as primary displays, considering the evaluation made based on the characteristic curve of luminance versus JND. A careful analysis of the lifetime should be made whenever the display of 2 megapixels is employed for mammography reports, as it is required for such use that the monitor must have at least 3 megapixels.
Finally, it was possible to confirm that there is a strong correlation between the time of use of the monitors and the resolution of clinical digital display monitors.
CONSENT FOR PUBLICATION
Not applicable.
CONFLICT OF INTEREST
The authors declare no conflict of interest, financial or otherwise.
ACKNOWLEDGMENTS
The authors thank the Brazilian Agencies CNPq and CAPES for their partial financial support.